Researchers from the University tested the brain activity of 10 expert stone tool makers (flint knappers) as they undertook a stone tool-making task and a standard language test.

Brain blood flow activity measured

They measured the brain blood flow activity of the participants as they performed both tasks using functional Transcranial Doppler Ultrasound (fTCD), commonly used in clinical settings to test patients' language functions after brain damage or before surgery.The researchers found that brain patterns for both tasks correlated, suggesting that they both use the same area of the brain. Language and stone tool-making are considered to be unique features of humankind that evolved over millions of years.
Darwin was the first to suggest that tool-use and language may have co-evolved, because they both depend on complex planning and the coordination of actions but until now there has been little evidence to support this.Dr Georg Meyer, from the University Department of Experimental Psychology, said: "This is the first study of the brain to compare complex stone tool-making directly with language.

Tool use and language co-evolved

"Our study found correlated blood-flow patterns in the first 10 seconds of undertaking both tasks. This suggests that both tasks depend on common brain areas and is consistent with theories that tool-use and language co-evolved and share common processing networks in the brain."Dr Natalie Uomini from the University's Department of Archaeology, Classics & Egyptology, said: "Nobody has been able to measure brain activity in real time while making a stone tool. This is a first for both archaeology and psychology."
"This is the first time an experiment like this has simulated the evolution of structure in the early universe," said Cheng Chin, professor in physics. Chin and his associates reported their feat in the Aug. 1 edition of Science Express, and it will appear soon in the print edition of Science.

Chin pursued the project with lead author Chen-Lung Hung, PhD'11, now at the California Institute of Technology, and Victor Gurarie of the University of Colorado, Boulder. Their goal was to harness ultracold atoms for simulations of the big bang to better understand how structure evolved in the infant universe.

The cosmic microwave background is the echo of the big bang. Extensive measurements of the CMB have come from the orbiting Cosmic Background Explorer in the 1990s, and later by the Wilkinson Microwave Anisotropy Probe and various ground-based observatories, including the UChicago-led South Pole Telescope collaboration. These tools have provided cosmologists with a snapshot of how the universe appeared approximately 380,000 years following the Big Bang, which marked the beginning of the universe.

It turns out that under certain conditions, a cloud of atoms chilled to a billionth of a degree above absolute zero (-459.67 degrees Fahrenheit) in a vacuum chamber displays phenomena similar to those that unfolded following the big bang, Hung said.

"At this ultracold temperature, atoms get excited collectively. They act as if they are sound waves in air," he said. The dense package of matter and radiation that existed in the very early universe generated similar sound-wave excitations, as revealed by COBE, WMAP and the other experiments.

The synchronized generation of sound waves correlates with cosmologists' speculations about inflation in the early universe. "Inflation set out the initial conditions for the early universe to create similar sound waves in the cosmic fluid formed by matter and radiation," Hung said.

Big bang's rippling echo


The sudden expansion of the universe during its inflationary period created ripples in space-time in the echo of the big bang. One can think of the big bang, in oversimplified terms, as an explosion that generated sound, Chin said. The sound waves began interfering with each other, creating complicated patterns. "That's the origin of complexity we see in the universe," he said.

These excitations are called Sakharov acoustic oscillations, named for Russian physicist Andrei Sakharov, who described the phenomenon in the 1960s. To produce Sakharov oscillations, Chin's team chilled a flat, smooth cloud of 10,000 or so cesium atoms to a billionth of a degree above absolute zero, creating an exotic state of matter known as a two-dimensional atomic superfluid.

Then they initiated a quenching process that controlled the strength of the interaction between the atoms of the cloud. They found that by suddenly making the interactions weaker or stronger, they could generate Sakharov oscillations.

The universe simulated in Chin's laboratory measured no more than 70 microns in diameter, approximately the diameter as a human hair. "It turns out the same kind of physics can happen on vastly different length scales," Chin explained. "That's the power of physics."

The goal is to better understand the cosmic evolution of a baby universe, the one that existed shortly after the big bang. It was much smaller then than it is today, having reached a diameter of only a hundred thousand light years by the time it had left the CMB pattern that cosmologists observe on the sky today.

In the end, what matters is not the absolute size of the simulated or the real universes, but their size ratios to the characteristic length scales governing the physics of Sakharov oscillations. "Here, of course, we are pushing this analogy to the extreme," Chin said.

380,000 years versus 10 milliseconds


"It took the whole universe about 380,000 years to evolve into the CMB spectrum we're looking at now," Chin said. But the physicists were able to reproduce much the same pattern in approximately 10 milliseconds in their experiment. "That suggests why the simulation based on cold atoms can be a powerful tool," Chin said.

None of the Science co-authors are cosmologists, but they consulted several in the process of developing their experiment and interpreting its results. The co-authors especially drew upon the expertise of UChicago's Wayne Hu, John Carlstrom and Michael Turner, and of Stanford University's Chao-Lin Kuo.

Hung noted that Sakharov oscillations serve as an excellent tool for probing the properties of cosmic fluid in the early universe. "We are looking at a two-dimensional superfluid, which itself is a very interesting object. We actually plan to use these Sakharov oscillations to study the property of this two-dimensional superfluid at different initial conditions to get more information."

The research team varied the conditions that prevailed early in the history of the expansion of their simulated universes by quickly changing how strongly their ultracold atoms interacted, generating ripples. "These ripples then propagate and create many fluctuations," Hung said. He and his co-authors then examined the ringing of those fluctuations.

Today's CMB maps show a snapshot of how the universe appeared at a moment in time long ago. "From CMB, we don't really see what happened before that moment, nor do we see what happened after that," Chin said. But, Hung noted, "In our simulation we can actually monitor the entire evolution of the Sakharov oscillations."

Chin and Hung are interested in continuing this experimental direction with ultracold atoms, branching into a variety of other types of physics, including the simulation of galaxy formation or even the dynamics of black holes.

"We can potentially use atoms to simulate and better understand many interesting phenomena in nature," Chin said. "Atoms to us can be anything you want them to be."
Cosmic rays can damage electronics on Earth, as well as human DNA, putting astronauts in space especially at risk.The research, which draws on data collected by IceTop, the IceCube Observatory's surface array of detectors, is published online in Physical Review D, a leading journal in elementary particle physics.

University of Delaware physicist Bakhtiyar Ruzybayev is the study's corresponding author. UD scientists were the lead group for the construction of IceTop with support from the National Science Foundation and coordination by the project office at the University of Wisconsin, Madison.The more scientists learn about the energy spectrum and chemical composition of cosmic rays, the closer humanity will come to uncovering where these energetic particles originate.

Cosmic rays are known to reach energies above 100 billion giga-electron volts (1011 GeV). The data reported in this latest paper cover the energy range from 1.6 times 106 GeV to 109 GeV.Researchers are particularly interested in identifying cosmic rays in this interval because the transition from cosmic rays produced in the Milky Way Galaxy to "extragalactic" cosmic rays, produced outside our galaxy, is expected to occur in this energy range.Exploding stars called supernovae are among the sources of cosmic rays here in the Milky Way, while distant objects such as collapsing massive stars and active galactic nuclei far from the Milky Way are believed to produce the highest energy particles in nature.

As Ruzybayev points out, the cosmic-ray energy spectrum does not follow a simple power law between the "knee" around 4 PeV (peta-electron volts) and the "ankle" around 4 EeV (exa-electron volts), as previously thought, but exhibits features like hardening around 20 PeV and steepening around 130 PeV.

"The spectrum steepens at the 'knee,' which is generally interpreted as the beginning of the end of the galactic population. Below the knee, cosmic rays are galactic in origin, while above that energy, particles from more distant regions in our universe become more and more likely," Ruzybayev explained. "These measurements provide new constraints that must be satisfied by any models that try to explain the acceleration and propagation of cosmic rays."IceTop consists of 81 stations in its final configuration, covering an area of one square kilometer on the South Pole surface above the detectors of IceCube, which are buried over a mile deep in the ice. The analysis presented in this article was performed using data taken from June 2010 to May 2011, when the array consisted of only 73 stations.The IceCube collaboration includes nearly 250 people from 39 research institutions in 11 countries, including the University of Delaware.
No ordinary speaker, it consists of a thin sheet of rubber sandwiched between two layers of a saltwater gel, and it's as clear as a window. A high-voltage signal that runs across the surfaces and through the layers forces the rubber to rapidly contract and vibrate, producing sounds that span the entire audible spectrum, 20 hertz to 20 kilohertz.But this is not an electronic device, nor has it ever been seen before. Published in the August 30 issue of Science, it represents the first demonstration that electrical charges carried by ions, rather than electrons, can be put to meaningful use in fast-moving, high-voltage devices.

"Ionic conductors could replace certain electronic systems; they even offer several advantages," says co-lead author Jeong-Yun Sun, a postdoctoral fellow at the Harvard School of Engineering and Applied Sciences (SEAS).For example, ionic conductors can be stretched to many times their normal area without an increase in resistivity -- a problem common in stretchable electronic devices. Secondly, they can be transparent, making them well suited for optical applications. Thirdly, the gels used as electrolytes are biocompatible, so it would be relatively easy to incorporate ionic devices -- such as artificial muscles or skin -- into biological systems.
After all, signals carried by charged ions are the electricity of the human body, allowing neurons to share knowledge and spurring the heart to beat. Bioengineers would dearly love to mesh artificial organs and limbs with that system.

The audio speaker represents a robust proof of concept for ionic conductors because producing sounds across the entire audible spectrum requires both high voltage (to squeeze hard on the rubber layer) and high-speed actuation (to vibrate quickly) -- two criteria which are important for applications but which would have ruled out the use of ionic conductors in the past.The traditional constraints are well known: high voltages can set off electrochemical reactions in ionic materials, producing gases and burning up the materials. Ions are also much larger and heavier than electrons, so physically moving them through a circuit is typically slow. The system invented at Harvard overcomes both of these problems, opening up a vast number of potential applications including not just biomedical devices, but also fast-moving robotics and adaptive optics.

This research was supported by the National Science Foundation through a grant to the Materials Research Science and Engineering Center at Harvard University (DMR-0820484) and by the Army Research Office (W911NF-09-1-0476). It was also enabled in part by the Department of Energy (ER45852) and the Agency for Science, Technology, and Research (A*STAR), Singapore.
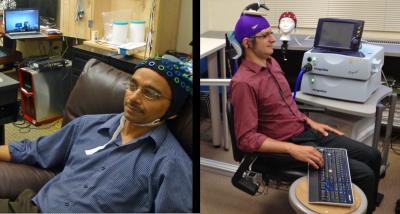
Using electrical brain recordings and a form of magnetic stimulation, Rajesh Rao sent a brain signal to Andrea Stocco on the other side of the UW campus, causing Stocco's finger to move on a keyboard.While researchers at Duke University have demonstrated brain-to-brain communication between two rats, and Harvard researchers have demonstrated it between a human and a rat, Rao and Stocco believe this is the first demonstration of human-to-human brain interfacing.

"The Internet was a way to connect computers, and now it can be a way to connect brains," Stocco said. "We want to take the knowledge of a brain and transmit it directly from brain to brain."

The researchers captured the full demonstration on video recorded in both labs. The version available at the end of this story has been edited for length. Rao, a UW professor of computer science and engineering, has been working on brain-computer interfacing (BCI) in his lab for more than 10 years and just published a textbook on the subject. In 2011, spurred by the rapid advances in BCI technology, he believed he could demonstrate the concept of human brain-to-brain interfacing. So he partnered with Stocco, a UW research assistant professor in psychology at the UW's Institute for Learning & Brain Sciences.

On Aug. 12, Rao sat in his lab wearing a cap with electrodes hooked up to an electroencephalography machine, which reads electrical activity in the brain. Stocco was in his lab across campus wearing a purple swim cap marked with the stimulation site for the transcranial magnetic stimulation coil that was placed directly over his left motor cortex, which controls hand movement.The team had a Skype connection set up so the two labs could coordinate, though neither Rao nor Stocco could see the Skype screens.Rao looked at a computer screen and played a simple video game with his mind. When he was supposed to fire a cannon at a target, he imagined moving his right hand (being careful not to actually move his hand), causing a cursor to hit the "fire" button. Almost instantaneously, Stocco, who wore noise-canceling earbuds and wasn't looking at a computer screen, involuntarily moved his right index finger to push the space bar on the keyboard in front of him, as if firing the cannon. Stocco compared the feeling of his hand moving involuntarily to that of a nervous tic.


"It was both exciting and eerie to watch an imagined action from my brain get translated into actual action by another brain," Rao said. "This was basically a one-way flow of information from my brain to his. The next step is having a more equitable two-way conversation directly between the two brains."

The technologies used by the researchers for recording and stimulating the brain are both well-known. Electroencephalography, or EEG, is routinely used by clinicians and researchers to record brain activity noninvasively from the scalp. Transcranial magnetic stimulation, or TMS, is a noninvasive way of delivering stimulation to the brain to elicit a response. Its effect depends on where the coil is placed; in this case, it was placed directly over the brain region that controls a person's right hand. By activating these neurons, the stimulation convinced the brain that it needed to move the right hand.Computer science and engineering undergraduates Matthew Bryan, Bryan Djunaedi, Joseph Wu and Alex Dadgar, along with bioengineering graduate student Dev Sarma, wrote the computer code for the project, translating Rao's brain signals into a command for Stocco's brain.

"Brain-computer interface is something people have been talking about for a long, long time," said Chantel Prat, assistant professor in psychology at the UW's Institute for Learning & Brain Sciences, and Stocco's wife and research partner who helped conduct the experiment. "We plugged a brain into the most complex computer anyone has ever studied, and that is another brain."At first blush, this breakthrough brings to mind all kinds of science fiction scenarios. Stocco jokingly referred to it as a "Vulcan mind meld." But Rao cautioned this technology only reads certain kinds of simple brain signals, not a person's thoughts. And it doesn't give anyone the ability to control your actions against your will.


Both researchers were in the lab wearing highly specialized equipment and under ideal conditions. They also had to obtain and follow a stringent set of international human-subject testing rules to conduct the demonstration.

"I think some people will be unnerved by this because they will overestimate the technology," Prat said. "There's no possible way the technology that we have could be used on a person unknowingly or without their willing participation."

Stocco said years from now the technology could be used, for example, by someone on the ground to help a flight attendant or passenger land an airplane if the pilot becomes incapacitated. Or a person with disabilities could communicate his or her wish, say, for food or water. The brain signals from one person to another would work even if they didn't speak the same language.Rao and Stocco next plan to conduct an experiment that would transmit more complex information from one brain to the other. If that works, they then will conduct the experiment on a larger pool of subjects.
Scientists now have made the first-ever accurate determination of a solid-state triple point in a substance called vanadium dioxide, which is known for switching rapidly -- in as little as one 10-trillionth of a second -- from an electrical insulator to a conductor, and thus could be useful in various technologies.

"These solid-state triple points are fiendishly difficult to study, essentially because the different shapes of the solid phases makes it hard for them to match up happily at their interfaces," said David Cobden, a University of Washington physics professor."There are, in theory, many triple points hidden inside a solid, but they are very rarely probed.".In 1959, researchers at Bell Laboratories discovered vanadium dioxide's ability to rearrange electrons and shift from an insulator to a conductor, called a metal-insulator transition. Twenty years later it was discovered that there are two slightly different insulating phases.

The new research shows that those two insulating phases and the conducting phase in solid vanadium dioxide can coexist stably at 65 degrees Celsius, give or take a tenth of a degree (65 degrees C is equal to 149 degrees Fahrenheit).To find that triple point, Cobden's team stretched vanadium dioxide nanowires under a microscope. The team had to build an apparatus to stretch the tiny wires without breaking them, and it was the stretching that allowed the observation of the triple point, Cobden said.

It turned out that when the material manifested its triple point, no force was being applied -- the wires were not being stretched or compressed.The researchers originally set out simply to learn more about the phase transition and only gradually realized that the triple point was key to it, Cobden said. That process took several years, and then it took a couple more to design an experiment to pin down the triple point."No previous experiment was able to investigate the properties around the triple point," he said.

He regards the work as "just a step, but a significant step" in understanding the metal-insulator transition in vanadium dioxide. That could lead to development of new types of electrical and optical switches, Cobden said, and similar experiments could lead to breakthroughs with other materials."If you don't know the triple point, you don't know the basic facts about this phase transition," he said. "You will never be able to make use of the transition unless you understand it better."
The discovery alters understanding of the chemistry that moves manganese and other elements, like oxygen and carbon, through the natural world. Manganese is an essential nutrient for most organisms and helps plants produce oxygen during photosynthesis.

"You wouldn't think manganese is that important, but without manganese, we wouldn't have the molecular oxygen that we breathe," said study co-author George Luther, Maxwell P. and Mildred H. Harrington Professor of Oceanography in the School of Marine Science and Policy within UD's College of Earth, Ocean, and Environment.

Manganese is present in the environment in three forms -- manganese(II), manganese(III) and manganese(IV) -- the difference related to the oxidation state, or number of electrons present. When elements lose or gain an electron, the oxidation state changes in a "redox reaction," like when iron turns into rust by losing electrons to oxygen in air.

The second-most common metal in Earth's crust, manganese rapidly changes between oxidation states while reacting with other elements in the environment.Traditionally, manganese(II) and manganese(IV) were believed to be the dominant forms in aquatic environments. But in the mid-2000s, Luther found in a surprising result that manganese(III) was also present in a Black Sea "transition zone," an area where oxygen levels are relatively high near the surface but gradually diminish deeper down in the water.

Suspecting that this intermediary form was far more widespread than the somewhat unique conditions of the Black Sea, he and his Canadian colleagues Bjørn Sundby of the University of Quebec at Rimouski and Al Mucci of McGill University, whom he has worked with more than 20 years, set out for the largest estuary in the world: the Gulf of Saint Lawrence off the southeast corner of Canada.There they pulled up samples of mud from the seafloor, where in the top few inches of sediment, there is also a transition zone of diminishing oxygen amounts. Andrew Madison, lead author on the Science paper and Luther's former graduate student, used a new technique to differentiate between manganese forms.

"It was a bit frustrating, and I spent about two and a half years working through methodological challenges and complications," said Madison, who finished his doctorate last year and now works as geochemist at Golder Associates Inc. in New Jersey. "But it was also pretty rewarding when I finally got something to work."

His results showed that manganese(III) comprised up to 90 percent of the total manganese present in the Canadian study sites. The implication is that the metal is found in other marine environments where there is a gradation of oxygen concentrations, whether in the water column of the Black Sea, sediment in the Gulf of Lawrence or a Delaware salt marsh."We saw it all through the Saint Laurentian Estuary where we studied," Luther said. "We did some work in a local salt marsh and found it. Wherever we've been able to look for it, we've found it. By implication, it should be found in all ocean sediments."

The findings help explain anomalies in manganese models that have puzzled scientists. Other researchers studying manganese did not make specific measurements for manganese(II) versus manganese(III), Luther said. Rather, they measured total dissolved manganese and assumed it was the former.This missing link in the manganese cycle may shed light on the complex connections between the biology, geology and chemistry -- called biogeochemistry -- in ocean environments.The biogeochemistry of marine sediments revolves around organic matter, like bits of dead algae, that fall through the water to the bottom of the ocean. Bacteria consume that debris, setting off a chain of reactions.

"In sediments, bacteria prefer to consume molecular oxygen and nitrate first due to their high energy gain," Madison said. "After those are consumed, bacteria then couple organic matter oxidation to manganese oxide reduction, which can produce soluble manganese(III)."In their paper, the researchers call for the conceptual model of the sedimentary redox cycle to be revised to include dissolved manganese(III).

"Manganese is helpful to produce organic matter in the surface waters through photosynthesis," Luther said. "But in the sediments, the higher oxidation state manganese is used to decompose organic matter. So it's a really interesting cycle."Luther, his students and his Oregon Health & Science University collaborator, Brad Tebo, plan to return to Canada to continue work on the microbiology and chemistry of the processes, hopefully to find out which organisms are helping the manganese oxidation process.
Since the 1960s, it has been known that groundwater resources in certain provinces of China are contaminated with arsenic. Estimates of the numbers of affected people have risen year by year. In the most recent survey -- conducted by the Chinese Ministry of Health between 2001 and 2005 -- more than 20,000 (5%) of the 445,000 wells tested showed arsenic concentrations higher than 50 µg/L. According to official estimates, almost 6 million people consume drinking water with an arsenic content of more than 50 µg/L and almost 15 million are exposed to concentrations exceeding 10 µg/L (the guideline value recommended by the WHO).

Given the sheer size of China and the time and expense involved in testing for arsenic contamination, several more decades would probably be required to screen all of the millions of groundwater wells. Accordingly, a group of researchers from Eawag and the China Medical University in Shenyang developed a statistical risk model making use of existing data on geology, soil characteristics and topographic features. This model was calibrated using available arsenic measurements. The predictions of unsafe or safe areas showed a high level of agreement, both for known high-risk areas and for areas where elevated arsenic levels had been ruled out by sampling campaigns.

In addition, large areas have now been identified as potentially at risk, such as the basins of the Tarim (Xinjiang), Ejina (Inner Mongolia) and Heihe (Gansu), or the North China Plain (Henan and Shandong). Arsenic concentrations above 10 µg/L are predicted for a total area of 580,000 km2. When these results were combined with the latest available population data, it was found that almost 20 million people across China live in high-risk areas.

Geochemist Annette Johnson concedes: "This figure may be an overestimate, as we lack reliable information on the number of people with treated water sup-plies." But in the long term, she adds, China will remain dependent on groundwater as a source of drinking water, particularly in the arid provinces. The risk model shows where conventional groundwater quality monitoring efforts are best focussed: "Our method permits more targeted sampling cam-paigns and saves time in identifying populations at risk. The Chinese authorities are adopting our maps in the national monitoring programme." Johnson is convinced that the model could also be used in other countries where groundwater is known or suspected to be contaminated with arsenic -- for example, in Africa or in central Asia, where risk assessments for arsenic contamination have not yet been performed.

Arsenic background

Arsenic is one of the most common inorganic contaminants found in drinking water worldwide. This metalloid occurs as a natural component of sediments, with small quantities being dissolved in groundwater as a result of weathering. The inorganic salts of arsenic are tasteless and odourless, but highly toxic to humans. If ingested over long periods, even low concentrations can cause damage to health, including hyperpigmentation of the skin, hyperkeratosis on the palms and soles, disorders of liver, cardiovascular and kidney function, and various types of cancer.

Problems arise from the fact that firstly, arsenic concentrations can vary widely at the local level and, secondly, people in many areas are completely unaware of the risk because their groundwater wells have never been screened for arsenic. Concentrations below 10 µg/L are considered safe. This concentration is therefore recommended by the World Health Organi-zation as a guideline value for arsenic in drinking water. In China, the standard guideline has just recently changed from 50 µg/L to 10 µg/L. In many other studies, e.g. at various sites in Inner Mongolia, arsenic concentrations of more than 100 µg/L and up to 1500 µg/L have been measured.
The movies promise to give astronomers a better understanding of how active black holes shape galaxy evolution. While matter drawn completely into a black hole cannot escape its enormous gravitational pull, most infalling material drawn toward it first joins an orbiting region known as an accretion disk encircling the black hole. Magnetic fields surrounding the black hole are thought to entrain some of this ionized gas, ejecting it as very high-velocity jets.

"Central supermassive black holes are a key component in all big galaxies," said Eileen T. Meyer of the Space Telescope Science Institute (STScI) in Baltimore, Md., the Hubble study's lead author. "Most of these black holes are believed to have gone through an active phase, and black-hole-powered jets from this active phase play a key role in the evolution of galaxies. By studying the details of this process in the nearest galaxy with an optical jet, we can hope to learn more about galaxy formation and black hole physics in general."

The Hubble movies reveal for the first time that the jet's river of plasma travels in a spiral motion. This motion is considered strong evidence that the plasma may be traveling along a magnetic field, which the team thinks is coiled like a helix. The magnetic field is believed to arise from a spinning accretion disk of material around a black hole. Although the magnetic field cannot be seen, its presence is inferred by the confinement of the jet along a narrow cone emanating from the black hole.

"We analyzed several years' worth of Hubble data of a relatively nearby jet, which allowed us to see lots of details," Meyer said. "The only reason you see the distant jet in motion at all over just a few years is because it is traveling very fast."

Meyer found evidence for the magnetic field's suspected helical structure in several locations along the jet. In the outer part of the M87 jet, for example, one bright gas clump, called knot B, appears to zigzag, as if it were moving along a spiral path. Several other gas clumps along the jet also appear to loop around an invisible structure. "Past observations of black hole jets couldn't distinguish between radial motion and side-to-side motion, so they didn't provide us with detailed information of the jet's behavior," Meyer explained.

M87 resides at the center of the neighboring Virgo cluster of roughly 2,000 galaxies, located 50 million light-years away. The galaxy's monster black hole is several billion times more massive than our Sun.

In addition, the Hubble data provided information on why the jet is composed of a long string of gas blobs, which appear to brighten and dim over time.

"The jet structure is very clumpy. Is this a ballistic effect, like cannonballs fired sequentially from a cannon?" Meyer asked. "Or, is there some particularly interesting physics going on, such as a shock that is magnetically driven?"

Meyer's team found evidence for both scenarios. "We found things that move quickly," Meyer said. "We found things that move slowly. And, we found things that are stationary. This study shows us that the clumps are very dynamic sources."

The research team spent eight months analyzing 400 observations from Hubble's Wide Field Planetary Camera 2 and Advanced Camera for Surveys. The observations were taken from 1995 to 2008. Several team members, however, have been observing M87 for 20 years. Only Hubble's sharp vision allowed the research team to measure the jet's slight motion in the sky over 13 years. Meyer's team also measured features in the hot plasma as small as 20 light-years wide.

It's too soon to tell whether all black-hole-powered jets behave like the one in M87. That's why Meyer plans to use Hubble to study three more jets. "It's always dangerous to have exactly one example because it could be a strange outlier," Meyer said. "The M87 black hole is justification for looking at more jets."
Functional MRI scanners have been used in cognition research primarily to determine which brain areas are active while test subjects perform a specific task. The question is simple: is a particular brain region on or off? A research group at the Donders Institute for Brain, Cognition and Behaviour at Radboud University has gone a step further: they have used data from the scanner to determine what a test subject is looking at.
The researchers 'taught' a model how small volumes of 2x2x2 mm from the brain scans -- known as voxels -- respond to individual pixels. By combining all the information about the pixels from the voxels, it became possible to reconstruct the image viewed by the subject. The result was not a clear image, but a somewhat fuzzy speckle pattern. In this study, the researchers used hand-written letters.

Prior knowledge improves model performance
'After this we did something new', says lead researcher Marcel van Gerven. 'We gave the model prior knowledge: we taught it what letters look like. This improved the recognition of the letters enormously. The model compares the letters to determine which one corresponds most exactly with the speckle image, and then pushes the results of the image towards that letter. The result was the actual letter, a true reconstruction.'
'Our approach is similar to how we believe the brain itself combines prior knowledge with sensory information. For example, you can recognise the lines and curves in this article as letters only after you have learned to read. And this is exactly what we are looking for: models that show what is happening in the brain in a realistic fashion. We hope to improve the models to such an extent that we can also apply them to the working memory or to subjective experiences such as dreams or visualisations. Reconstructions indicate whether the model you have created approaches reality.'

Improved resolution; more possibilities
'In our further research we will be working with a more powerful MRI scanner,' explains Sanne Schoenmakers, who is working on a thesis about decoding thoughts. 'Due to the higher resolution of the scanner, we hope to be able to link the model to more detailed images. We are currently linking images of letters to 1200 voxels in the brain; with the more powerful scanner we will link images of faces to 15,000 voxels.'